With the Enterprise Survey Platform …
… complex survey projects become combinable
we help our customers to use data collected through individual surveys numerous times and to integrate it into existing applications. We make survey-overlapping views with regard to the results (functional, organisational, process-related) possible and thereby allow for a concerted coordination of the individual projects. We see ourselves as being a part of the whole and not an isolated solution.
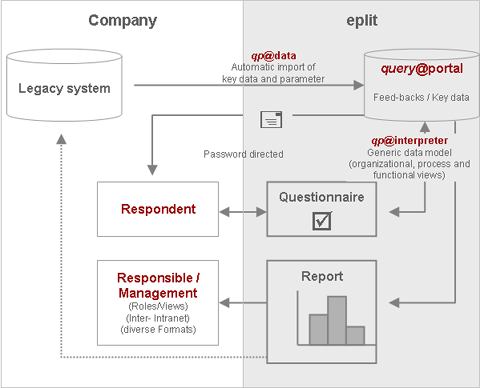
The Enterprise Survey Platform is made up of the software family query@portal, which in turn consists of the standard software query@portal, qp@data and the qp@interpreter.
Illustration: Diagram overview of the architecture of the Enterprise Survey Platform. (Enlarge illustration).

query@portal – high performance survey software
The heart of the “Enterprise Survey Platform” is our high performance software query@portal. It stands for high performance online surveys, comprehensive tools for field work and for the administration of participants as well as a reporting engine for survey-overlapping analyses and the provision of the results in a wide variety of formats (HTML, MS Excel, MS Power Point, PDF).
With query@portal one can realise individual surveys as well as projects that involve several surveys that are content-coordinated with each other. The reporting takes place either for each individual project separately as well as project-overlapping.
Further information as to the technical features of query@portal can be found here (pop-up).
qp@data – the key for system integration
Surveys are part of modern company management as well as quality management. They are being implemented on an ever increasing scale in companies. With qp@data we open and integrate the survey projects in your already existing IT landscape.
Apart from the automatic reading in of structure features (parameters such as departmental affiliation) with regard to the survey participants, with qp@data you can import performance figures from your IT system and these can then be encoded along the lines of the structural features of the survey participants. These therefore become analysable together with the survey results; the objective facts are mirrored directly to the subjective assessment of the survey participants. With qp@data the survey results and performance figures can be restored to your systems.
qp@interpreter – generic data model for functional, process and project-related views.
Not in every IT system are all of the required parameters available for a detailed analysis. A HR system does deliver all data on the organisational affiliation of an individual and on reporting chains; it cannot, however, make any statements on the collaboration of individuals on projects. The qp@interpreter closes this gap and programs the datasets with the missing information.
This is the decisive step that takes place, as in the case described above; apart from the report on the organisational unit, analyses on process or project participation as well as functional chains are also possible. Naturally this is not only valid for the analysis of an individual survey, but for all surveys undertaken within the company.
|

